Our why
Why spend hours on an image that search cannot read like a title?
Creators polish thumbnails because the feed is a visual contest. A viewer can react to a face, color, object, or unresolved moment before they finish reading. We wanted to know what makes that visual hook work, and whether it leaves a measurable trace in video performance.
“Notice,” “choose,” and “perform” sound similar. The project taught us that they are three different research questions.
Data collection
We started with public YouTube evidence.
We collected long-form video metadata and downloaded thumbnail images across categories. For performance analysis, views were adjusted for video age and compared only within the same channel. This reduced audience-size differences, but it could not reveal private click-through rate.
Views are downstream of recommendation exposure, topic, timing, audience, title, and the thumbnail. They are a noisy proxy for the click itself.
Reading the research
We translated design and psychology into seven visible checks.
We reviewed visual-attention research, Gestalt principles, processing fluency, thumbnail studies, and practitioner guidance. Then we turned recurring ideas into a fixed rubric that could be inspected rather than treated as intuition.
- 01Readable on a phone20%
- 02Clear visual hierarchy15%
- 03Subject separation15%
- 04Controlled clutter15%
- 05Picture adds to title20%
- 06Specific visual hook10%
- 07Category fit5%
The unlabeled pass
First, we tried reading the pixels without asking people.
This was not truly unsupervised training. It was a label-free measurement system: fixed computer-vision and semantic models measured the image, then reference percentiles described how typical or strong each trait looked.
Where contrast concentrates and how many focal regions compete.
PPOCR-style text regions, YuNet face boxes, and timestamp collisions.
Image-title alignment, visual-hook prompts, visible words, and duplication.
Compare the measurements with similar thumbnails, then apply the fixed rubric.
This route can describe a thumbnail. Without an outcome label, it cannot learn what people click or what performs.
The supervised performance model
Then we gave the model an outcome and a gate.
Logistic regression and a small LightGBM model learned from image and title measurements. Training used five channel-grouped folds, so one creator could not appear in both train and test data. The question was whether the model could order better and worse videos within the same channel.
The signal was real, but too weak to tell a creator which thumbnail would perform better. We kept the measurement work and dropped the prediction claim.
The choice study
Views were not enough, so we asked for the first choice directly.
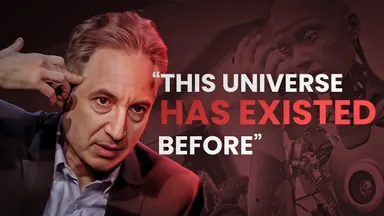
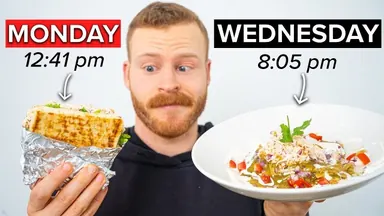
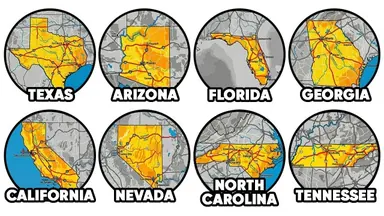
We built a second app that shows randomized thumbnail grids on mobile and desktop. A tap labels the chosen image and preserves the alternatives it competed against. The attention model controls for category and screen position, then learns a separate choice pattern for each device.


 first choice
Every selected image became one label. Every other image shown in that same grid became an observed alternative.
The current model
One shared representation, two supervised questions.
We combined frozen image and title meaning with visible structure. A small neural network learns an official YouTube category and a continuous channel-relative performance target at the same time. The category task works as useful semantic supervision. The performance task remains weak.
- Evaluation
- 5 channel-grouped folds
- Repeats
- 3 random seeds
- Training
- 25 epochs, batch 512
- Learning rate
- 0.001
How the app works
The report turns every model into something you can inspect.
Eyelicium keeps feed context, attention, design measurements, category language, and channel familiarity separate. It does not collapse them into a single claim about future clicks.
- 01Upload
Add the final crop, title, and category.
- 02Place
See it inside desktop and mobile feed mockups.
- 03Inspect
Read saliency, subject, text, face, and safe-area marks.
- 04Revise
Use the strongest and weakest checks as the next edit.
What comes next
The missing outcome is creator-owned CTR.
We can improve the attention sample, test stronger device-specific features, and validate category priming. The biggest step is simpler: compare thumbnail measurements with real impressions, click-through rate, and YouTube Test & Compare results.
Have creator-side data or want to volunteer for the next study? We will keep shared data scoped, anonymized, and clearly separated from public results.